In the human sciences, one of the most common definitions of social inequality is as follows:
“Social inequality is the result of an unequal distribution, in the mathematical sense of the term, of a society’s resources among its members, an unequal distribution due to the very structures of that society and giving rise to a feeling, legitimate or otherwise, of injustice among its members. ” Bihr, Alain, and Roland Pfefferkorn. Le système des inégalités. La Découverte, 2021
This definition draws on four main elements: an unequal mathematical distribution, the different resources at the root of the inequality, the nature of this unequal distribution being the result of society itself, and the emergence of a feeling of injustice.
When we talk about unequally distributed resources, we are not just talking about financial resources (income and wealth) but are also referring to social, political and educational resources… There is a multidimensionality of resources at the root of inequalities.
Two types of inequality are most frequently studied, namely inequality of income and inequality of wealth. To measure changes in inequality, researchers compare distributions of income (or wealth) and present the results in the form of indicators such as the Gini coefficient, the interquantile ratio, etc. However, other forms of inequality are more difficult to measure, for example in the areas of health or education.
How are income inequalities changing?
Income inequality is perhaps the best-known form of social inequality. Income inequality is often discussed in the media. Three types of income are taken into consideration: income from work, income from capital or property and social transfers. These are added together and adjusted for household composition to make them comparable.
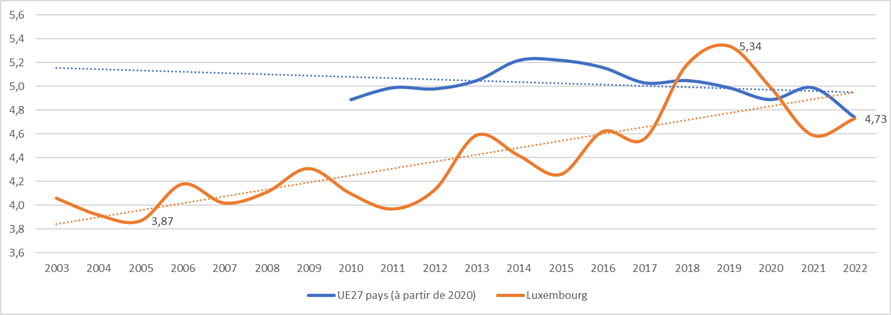
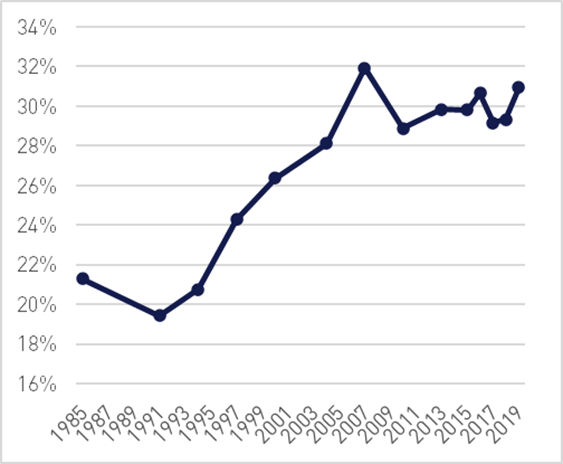
Over the long term, it is clear that income inequality in Luxembourg is increasing. For example, if we look at the interquintile ratio, which compares the share of income accruing to the 20% of the population with the lowest incomes (S20) with that of the 20% with the highest incomes (S80), this ratio has been rising in Luxembourg since the early 2000s. The ratio between the respective income shares of these two social groups was 4 in 2003, whereas the gap rose to 5.34 in 2019 and fell to 4.73 in 2022. This indicator has experienced inconsistent growth, so we should not be too hasty in rejoicing at this decline. Indeed, over the long term, we can observe that every improvement in this interquintile ratio is followed by a greater deterioration in the following years.
Evolution of the S80/S20 ratio
Source : Eurostat
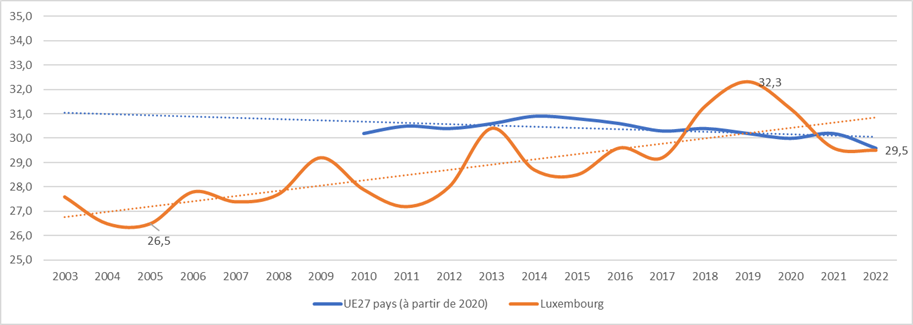
The Gini index, which represents another measure of income inequality by summarising the distribution of income in society, reveals similar results, i.e. an increasingly unequal distribution of income over the last twenty years. If the distribution of income is perfectly equal, the Gini index becomes zero; it is equal to 100 when inequality is at its maximum (one person having all the income). The closer the Gini index is to 100, the greater the income distribution inequality. In Luxembourg, the index rose from 27.5 to 32.3 between 2003 and 2019, and fell back to 29.5 in 2022. Like the S80/S20 interquintile ratio, the Gini index shows a growth in inequalities over the long term.
Evolution of the Gini index
Source : Eurostat
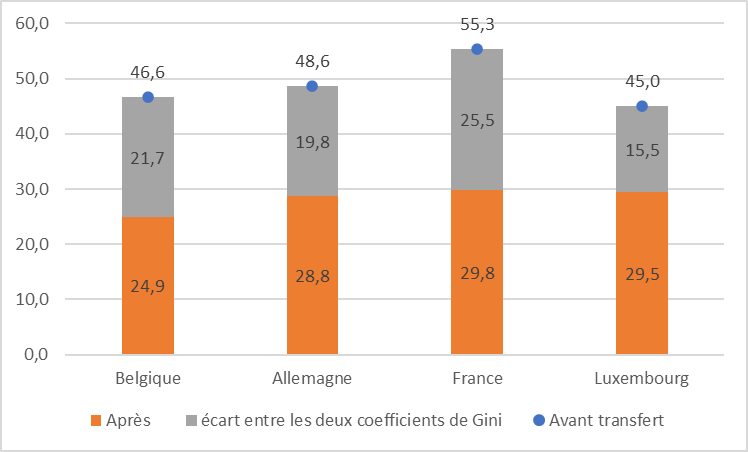
The role of the State in reducing social inequalities is illustrated by observing the Gini index before and after taxes and social transfers. Indeed, the Gini coefficient fell by almost 34% in 2022, from 45° in a primary distribution of gross income (‘market’ income) to 29.5° as a result of the redistribution of taxes and social benefits, whereas in 2015, for example, the reduction was 40%. This reduction in the impact of social transfers reflects a general trend in Luxembourg: previously, consideration of account transfers and taxes seemed to demonstrate that it was an effective tool for reducing income inequalities, but this has now changed. Indeed, since 2010, the role of transfers to households has tended to diminish considerably in the fight against inequality.
Gini index before and after social transfers, 2022
Source : Eurostat
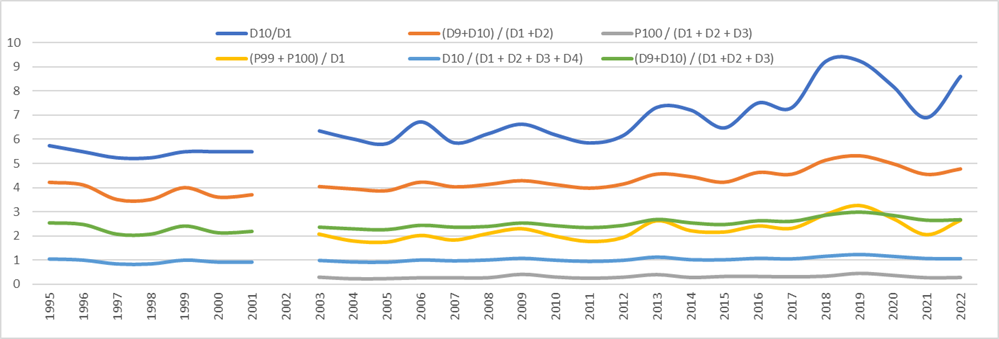
It is helpful to analyse interquantile ratios to provide an even more accurate picture of changes in inequality. The S80/S20 ratio considered above says nothing about changes that may occur between other fractions of the population, for example between the wealthiest percentage of the population and the rest of the households. The following graph shows the distribution of national income (known as equivalent income, because it is adjusted to reflect household composition) between different quantiles (groupings) of the population.
Trends in interquantile ranges
Source : Eurostat
The D10/D1 ratio compares the shares of total equivalent income received by the wealthiest 10% of households (D10) and the poorest 10% (D1). From 1995 until the mid-2000s, this indicator fluctuated around 5 to 6 (meaning that the richest 10% received 5 to 6 times more income than the poorest 10%), but it has since increased considerably, even exceeding 9 in 2019. In 2021, this D10/D1 ratio appeared to demonstrate an improvement as it had fallen, but the effect was short-lived, since in 2022 the indicator seemed set to reach the record level of 2019 once again. If we consider only the wealthiest 2% of people (P99 and P100) and relate their share of total income to that of the bottom 10%, we observe that there has been a similar upward trend since the mid-2000s. More generally, all the ratios shown in the graph above point to a growing divergence between high and low incomes since the middle of the last decade, whereas between 1995 and the middle of the 2000s, the gap between the incomes of the most well-off and those of the least well-off tended to narrow.
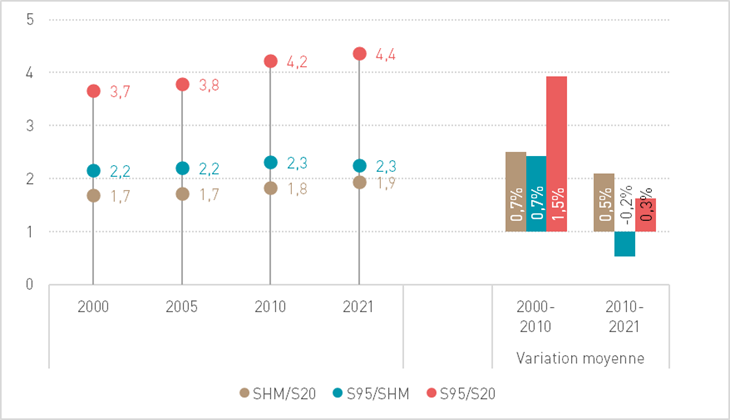
Trends in hourly pay differences
Source : Bills amending Article L.222-9 of the Labour Code; Graph: CSL
Over the last twenty years, the average hourly salary (SHM) has risen faster than the highest salary of the lowest paid 20% of employees (S20). The ratio between these two salary levels has risen from 1.69 in 2000 to 1.92 in 2021. The gap between the lowest salary among the top 5% of earners (S95) and the average salary has widened even more rapidly.
The cumulative increase in these two gaps shows that the ratio between the top 5% of salaries and the bottom 20% has been rising steadily for 20 years. In 2000, the lowest salary among the top 5% of earners was 3.65 times higher than the highest salary among the lowest 20% of earners. By 2021, the difference had risen to 4.40. It should also be noted that low salaries increased by almost 57% between 2000 and 2021, while the increase was more than 79% for average salaries and 88% for high salaries. As a result, it appears that the wage average in Luxembourg is pulled upwards by the highest salaries and that it is likely that many employees will see their salaries increase only slightly in relation to the highest salaries.
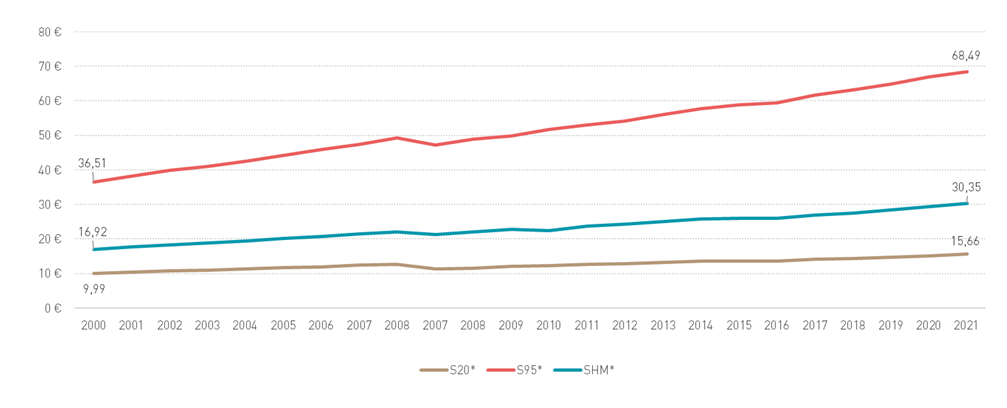
Trends in gross hourly wages
Source : Bills amending Article L.222-9 of the Labour Code; Graph: CSL
Tax and wealth inequalities
While the spotlight is on income in analyses of social inequalities, it should not be forgotten that income inequalities (are) fuelled by other forms of inequality, particularly inequalities in wealth, which are less frequently studied and for which data enabling in-depth analyses are far less available and accessible.
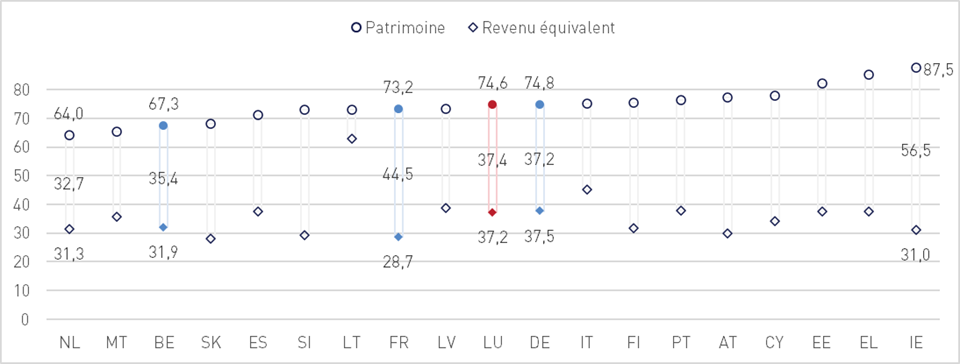
Firstly, it is important to note that inequalities in wealth are much greater than inequalities in income. A cross-comparison of the Gini coefficients for wealth and income distribution reveals inequalities in the distribution of wealth within the population that are two to three times greater: for Luxembourg, the Gini index is 74.6 instead of 37.2.
Gini coefficients for after-tax income and assets, per adult, 2021
Data: World Income Inequality Database, Luxembourg Income and Luxembourg Wealth Study. Graphic: CSL
In addition to these differences in distribution within the population, it should be noted that the various categories of wealth are held very unequally within the population. Thus, if we focus on the share of the different wealth categories held by the top decile of the distribution, it appears that they hold more than half of the total each time, with the exception of the main residence.
Within the population, 10% of households own 84% of property other than their main residence. If we restrict ourselves to households that own other property, it would appear that 10% of them own almost half (48%) of the total value.
Distribution of assets within the population, Luxembourg, 2018
Main residence
Other
property
Professional
assets
Residual assets
Cash and deposits
Financial investments
Share of total assets in this category held by the richest 10%
of the population as a whole
30,8%
83,9%
100%
59,1%
54,0%
97,8%
of owners in this category of asset
22,7%
48,8%
84,4%
57,0%
52,6%
65,0%
Data: World Income Inequality Database, Luxembourg Income and Luxembourg Wealth Study. Table: CSL
This concentration is exacerbated by two factors: firstly, the taxation of assets is largely non-existent in Luxembourg, and secondly, the resulting income is subject to preferential tax treatment. Apart from property, which is subject to a nominal property tax, none of these assets is subject to any tax as such until it changes hands. Only income derived from these assets, whether recurring (e.g. interest) or non-recurring (e.g. capital gains) is ultimately taxable. However, this taxation is applied on more favourable terms than the taxation of work earnings.
For example, financial investments are exempt from tax if they are held for more than 6 months, except in the case of major holdings (>10% of the company’s share capital), in which case they are taxed at half the overall rate. For another example we can draw on the case of an owner of an investment property, whereby rental income is taxed according to the normal tax scale, but it can be reduced by a whole series of costs linked to the rents received: maintenance and repairs, energy and insurance costs if they are not reimbursed by the tenant, interest charges (with no ceiling), etc. which in the end can result in situations where the lessor reduces their total taxable income to zero, whatever the source (rental income or earned income).
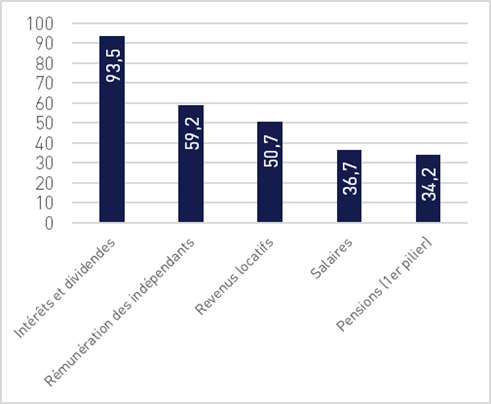
The Gini indices for income from these different forms of capital reflect this concentration of assets within a minority of households: interest and dividends show a value close to one, meaning that only a tiny minority benefit from almost all of this type of income. Similarly, rental income also has a much higher Gini index than salaries or first pillar pensions.
Gini coefficient for different income categories, Luxembourg, 2019
Data: World Income Inequality Database, Luxembourg Income and Luxembourg Wealth Study. Graphic: CSL
The result is that wealth, which is not subject to taxation, generates tax-advantaged income that can be reinvested in the acquisition of assets, creating a snowball effect for asset holders and generating increasing polarisation in society. In the Grand Duchy, since the mid-1980s, the proportion of households receiving both income from work in the top 20% of income from work and income from capital in the top quintile of income from capital has risen from around 20% to 33%, indicating a growing double concentration in these two forms of income.
Proportion of households belonging to both the top 20% of income from work and the top 20% of capital income, Luxembourg
Data: World Income Inequality Database, Luxembourg Income and Luxembourg Wealth Study. Graphic: CSL
What influence do inequalities have on access to healthcare?
The analysis of economic inequalities can be usefully supplemented by information from wider areas, such as health, for example.
There are a few objective indicators in this area, but they are mainly subjective indicators, which nonetheless make it possible to establish a connection between standard of living and satisfaction of health needs.
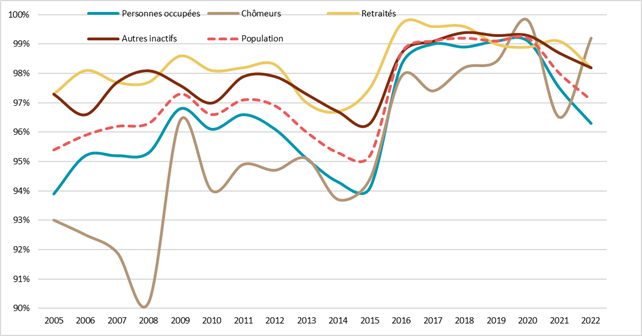
For example, in terms of the satisfaction rate for medical examinations or treatment, there has been a downward trend in satisfaction for all categories of people from 2010.
From 2015 onwards, the satisfaction rate for the various categories increased again, but up until 2021 the unemployed continue to be the worst off when it comes to satisfying the need for a medical examination or treatment (with the exception of 2020 and 2022). Retired people are generally the most satisfied in this respect (with the exception of 2019, 2020 and 2022).
Satisfaction rate for medical examination or treatment needs
Source : Eurostat
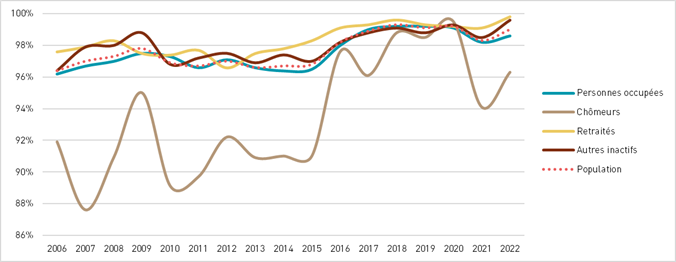
The situation is similar for dental check-ups and treatment, but with a greater divide, i.e. relatively high satisfaction rates for the population as a whole, with the unemployed clearly far behind until 2016. The situation seemed to have recovered in 2019 with a record level of satisfaction among the unemployed in 2020, but since then the divide has once again become more apparent.
Satisfaction rate for dental examination or treatment needs
Source : Eurostat
Whether or not medical and dental needs are met naturally has an impact on the state of health of the people concerned.
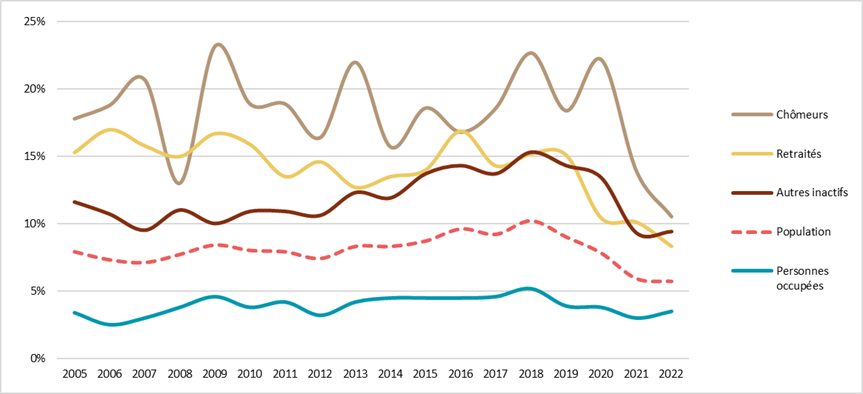
Indeed, if we ask people to assess their state of health, the unemployed generally score the lowest.
Self-perceived state of health: proportion of people reporting poor or very poor health
Source : Eurostat
Can education influence inequality?
The education system is supposed to fulfil an integrating role. The OECD’s Programme for International Student Assessment (PISA) survey studies the impact of socio-economic background on learning performance. The results of the PISA survey show that the socio-economic situation of families is closely correlated with pupil and school performance. While socio-economic disadvantage is not systematically the cause of poor performance, the socio-economic background of pupils and schools strongly influences learning outcomes. This is because advantaged families are better able to benefit from the teaching provided in schools, or because pupils from advantaged backgrounds generally attend better quality schools, or because schools are simply better equipped to help young people from advantaged backgrounds to develop and flourish.
Schools therefore tend to reproduce the effects of socio-economic advantage, rather than promoting a more balanced distribution of learning opportunities and learning outcomes. Luxembourg is not immune to this phenomenon. It is important to note, however, that in proportion to the country’s surface area, the Grand Duchy is home to a large foreign community, whose mother tongue is not necessarily one of the three official languages used in education, and this complicates the learning process.
In the light of the 2018 edition of PISA, where the focus was on analysing reading comprehension, the results highlight, as in previous editions, the effect of inequalities on education. According to the results of this study, Luxembourg is one of the worst performers when it comes to equality. The PISA study uses a socio-economic index to rank pupils, on the basis of which the top 25% of the index are considered to be advantaged and the bottom 25% are considered to be disadvantaged.
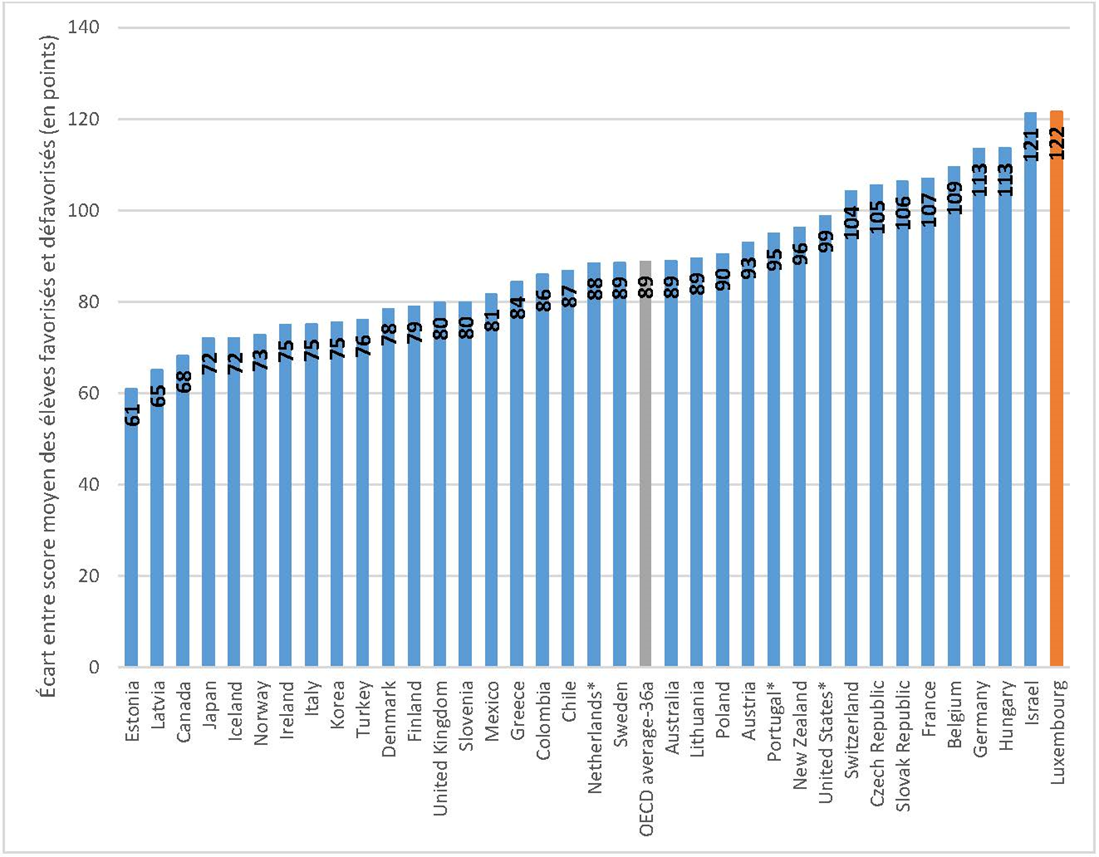
In the reading comprehension test, Luxembourg had the greatest difference between the scores obtained by advantaged and disadvantaged pupils, indicating the impact of socio-economic status on school performance. The following graph shows the difference between the average score achieved by advantaged pupils and the average score achieved by disadvantaged pupils. Advantaged pupils score an average of 537, while disadvantaged pupils score an average of just 415. This gap is the widest observed among all participating countries, and is 33 points above the OECD average.
Difference between advantaged and disadvantaged pupils in the reading comprehension test
Source : OCDE
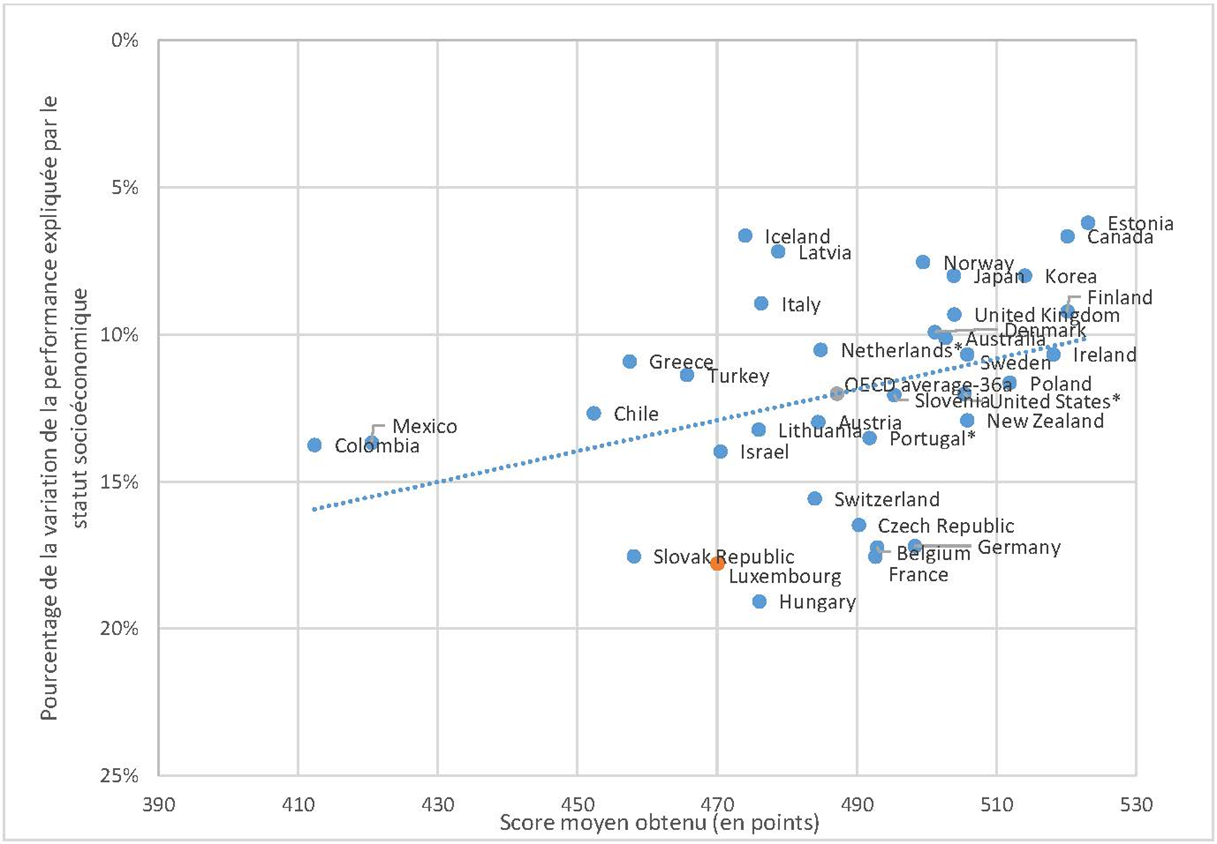
Socio-economic status is closely linked to the result achieved by a pupil. In the reading comprehension test, 17.8% of the difference in points scored can be explained by socio-economic differences. On average in the OECD, only 12% of the difference is affected. In Luxembourg, 18.9% of the variation in performance in mathematics is explained by socio-economic differences, compared with 13.8% for the OECD average. In Luxembourg, the effects of socio-economic status were most manifest in the science test, where 20.9% of the differences in results were due to these differences (compared with 12.8% at OECD level).The graph below shows the average score obtained by country and the influence of socio-economic status on performance in reading comprehension: thus, in general, among OECD members, a country with a low level of inequality scores better on this last skill; this connection is less manifest, however, if we consider all the participating countries and not just the OECD member countries. Luxembourg is below the OECD average for both performance and equality. Canada and Estonia, on the other hand, seem to excel.
Strength of the relationship between reading performance and socio-economic status
Source : OCDE
While in 2018 the influence of socio-economic status on performance in reading comprehension and science is slightly less obvious than in 2006, socio-economic status explains a larger proportion of the variation in mathematics performance than in 2006. However, Luxembourg’s relative position has not improved much: whereas in 2006 it was in last place for both science and reading among the OECD countries that took part in the two editions of the study (i.e. it had the highest impact caused by socio-economic status of all the participants) and in seventh position from the bottom of the ranking for mathematics, in 2018 Luxembourg finds itself in penultimate position for the first two subjects and, for mathematics, fifth from last position.
The difference between advantaged and disadvantaged pupils is also evident when considering the best and worst performances, rather than the average. In Luxembourg, 7.6% of pupils have a very high level of reading comprehension. Yet only 1.1% of disadvantaged pupils achieved this level, compared with 18.2% of advantaged pupils. The opposite is true for low performance: 29.3% of Luxembourg pupils have a low level of reading comprehension, but for disadvantaged pupils this rate is 47.7%, compared with only 10.2% for socio-economically advantaged pupils.
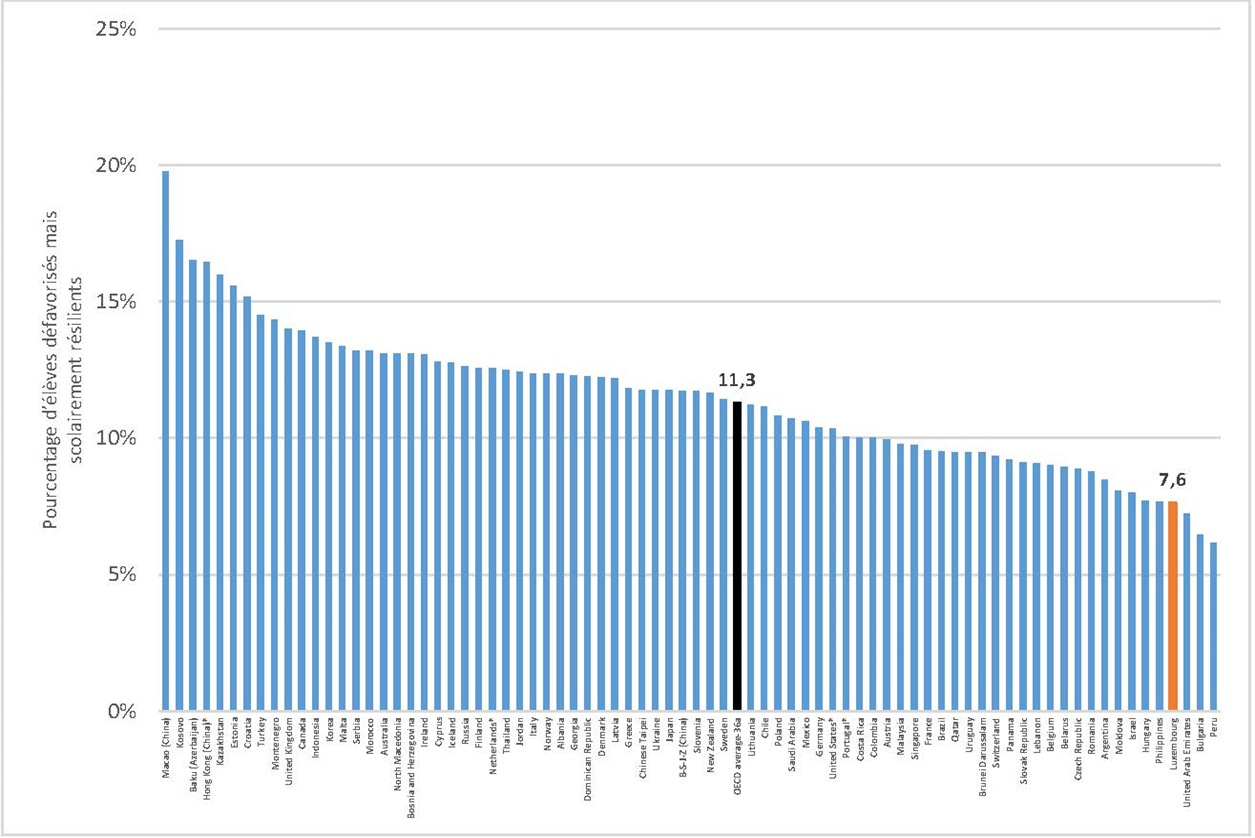
However, despite the difficulties associated with their socio-economic status, some disadvantaged pupils achieve good results. This ability to overcome socio-economic obstacles is referred to as ‘resilience’ in the PISA reports. As such, a pupil is considered to be academically resilient if he or she is among the 25% of pupils with the lowest level in the socio-economic index, but achieves a result among the top 25% in his or her country. Unlike the previous paragraph, where the level of results achieved is defined in absolute terms (a threshold score obtained), academic resilience considers a relative level of excellence. Based on the reading comprehension test, 7.6% of disadvantaged pupils in Luxembourg are academically resilient. As the next illustration shows, of all the participating countries, this rate is only lower in the United Arab Emirates, Bulgaria and Peru.
Percentage of academically-resilient pupils, by country
Source : OCDE
As mentioned in the introduction, however, there is some criticism that the results of the PISA study are not a good representation of pupils, given the particularities of the Luxembourg school system and situation.
How is poverty defined and measured?
An issue that is closely related to inequality is (relative) poverty. Indeed, in the highly developed countries of the West, it would make little sense to measure poverty in absolute terms, using for example a minimum amount of dollars or euros per day, or, in other words, defining an absolute poverty line, as is done for developing countries. As far back as 1776, the economist Adam Smith defined necessities as “not only those things which are indispensably necessary for the support of life, but also all those things which honest men, even of the lowest class of people, cannot decently wont for, according to the usages of the country” (“An Inquiry into the Nature and Causes of the Wealth of Nations”, Book V). This provides a relative definition of poverty, which varies according to the customs, the level of prosperity and the distribution of income in the country in question.
In the European Union, we therefore prefer to use the relative at-risk-of-poverty concept. To calculate this, we need firstly to determine the relative at-risk-of-poverty threshold. Any individual belonging to a household whose disposable income is below this at-risk-of-poverty threshold is therefore considered to be at risk of poverty, or, in everyday terms, to be poor. As part of the Europe-2020 strategy, which has now expired, the European Union has closely monitored an at-risk-of-poverty and social exclusion indicator that incorporates not only the risk of relative poverty, but also that of severe material deprivation and belonging to a household with a very low intensity of paid work. Viewed in this way, Luxembourg had a rate of 19.4% in 2022, while the classic at-risk-of-monetary-poverty rate is 17.4%.
Another way of considering at poverty is to examine another, more insidious form of poverty that is not included in the official statistics, known as ‘hidden’ poverty. This type of insecurity is observed in organisations working to combat this phenomenon and in the social services of the countries. In Luxembourg, the CSL has chosen financial assistance (including food aid) provided by social welfare offices and the number of people using food banks/subsidised groceries as indicators.
What is the level of at-risk-of-poverty and how is it developing in the Grand Duchy?
According to the Eurostat definition, the at-risk-of-poverty rate corresponds to the percentage of people with an income equivalent (based on household composition) of less than 60% of the median income equivalent (the median representing the income level at half the pay scale for the population as a whole). For Luxembourg, this median income equivalent will be 45,310 euros a year, which gives us a poverty threshold of 27,186 euros a year.
Trends in at-risk-of-poverty rates
Source : Eurostat
In Luxembourg, the at-risk-of-poverty rate rose sharply between 2011 and 2014, from just over 13.5% to 16.4% in 2014. If we study data from 1997 to 2013, Luxembourg is one of the countries with the highest rise in the at-risk-of-poverty rate, with an increase of around 5 percentage points over the period, the highest rise among its neighbours (Germany coming second with 4 points).
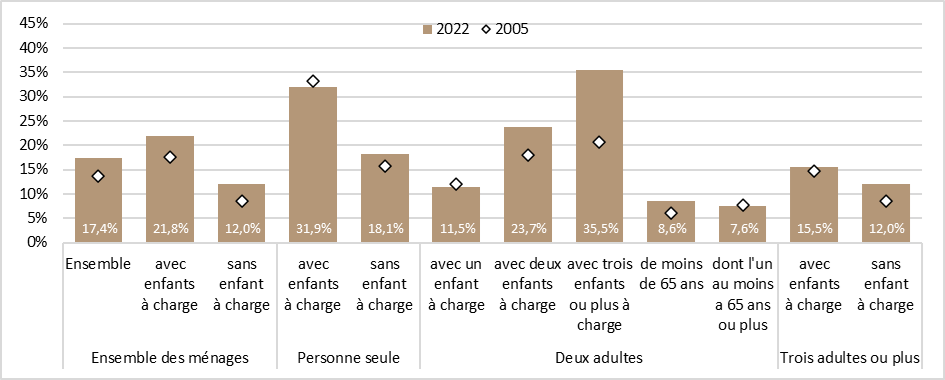
In 2022, Luxembourg’s at-risk-of-poverty rate is 17.4%, which is well above the rates seen before the mid-2000s. The at-risk-of-poverty rate can also be broken down in different ways, for example by household type, age category or activity. These different definitions provide a clearer picture of the populations concerned and should therefore guide the public authorities in their fight against poverty.
As far as the distribution of the risk of poverty according to household type is concerned, situations vary widely. Households without children are less exposed to the risk of poverty, with an average rate of 12% in 2022, whereas the at-risk-of-poverty rate is almost 22% for households with dependent children.
At-risk-of-poverty rate by household type
Source : Eurostat
In the category of households with children, the most difficult situations are those experienced by large families and single-parent households. Indeed, the at-risk-of-poverty rate rises to 35.5% and 31.9% respectively.
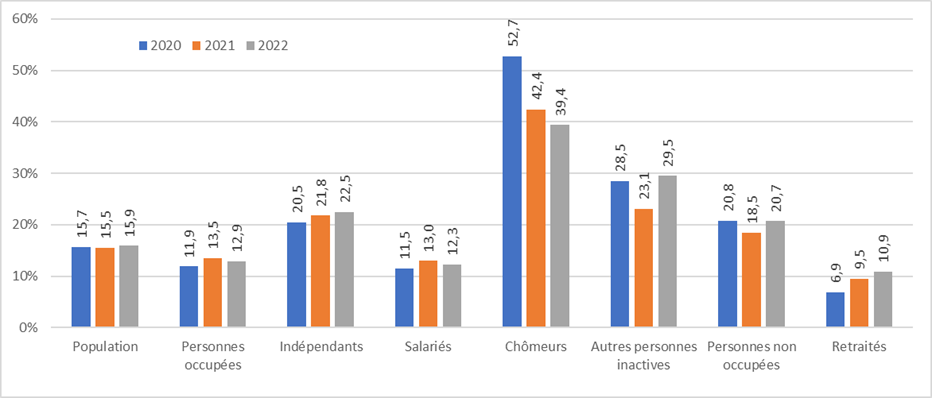
If we look at the risk of poverty in terms of employment status, it is evident that jobseekers are most at risk. Their at-risk-of-poverty rate is almost 40%, making them 2.5 times more at risk of poverty than all people over the age of 18. For the latter, the at-risk-of-poverty rate is just 15.9%.
At-risk-of-poverty rate by labour market status
Source : Eurostat
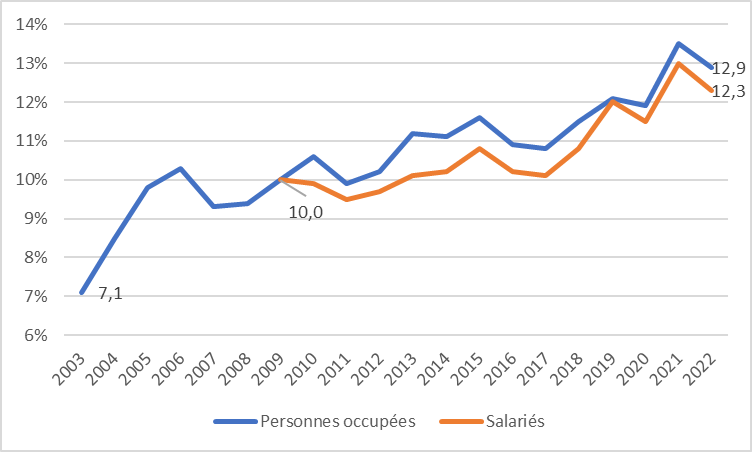
We can also see that in-work poverty is a very real phenomenon: working does not protect you from poverty. And this has been the case for years. In 2022, 16.8% of part-time workers and 11% of full-time workers were at risk of poverty. These figures put Luxembourg in first place in the Euro zone for risk of poverty among full-time workers and in seventh place for part-time workers.
Being employed does not therefore systematically protect you from living in a precarious situation; this is amply demonstrated by the risk of poverty rate whilst in work and its evolution. : in 2003, one in fourteen people in work were affected by poverty, whereas now, almost twenty years later, one in seven people in work is suffering from the effects of poverty.
In-work poverty risk rate
Source : Eurostat
Despite Luxembourg’s poor results in terms of jobseekers’ exposure to the risk of poverty, social transfers and the pension system play a vital role in reducing this risk.
What impact do social transfers have on the at-risk-of-poverty rate?
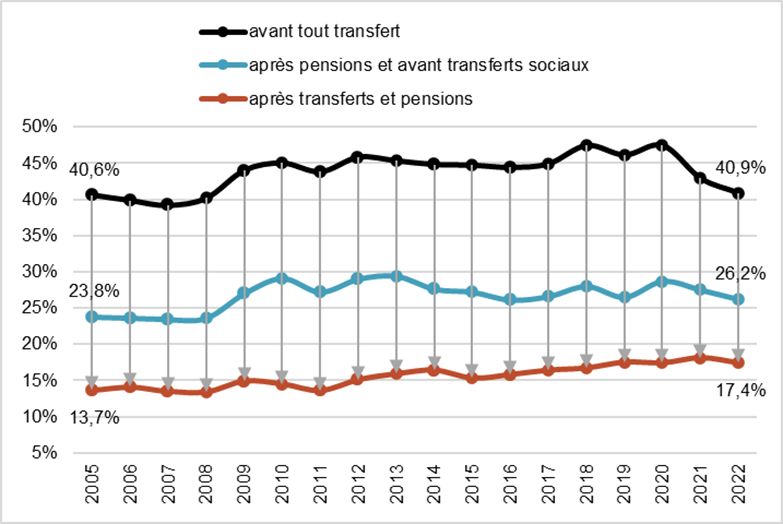
In 2022 the at-risk-of-poverty rate before social transfers and pensions is 40.9%. Thanks to the pensions paid to pensioners who are unemployed and have no earned income, the at-risk-of-poverty rate has been reduced by around 36% to just under 26.2%.
Lastly, social transfers for all households that meet the eligibility criteria lead to a further reduction of one-third, to 17.4% of the at-risk-of-poverty rate. All in all, pensions and social transfers reduce the at-risk-of-poverty rate by 57.5%.
At-risk-of-poverty rate before and after pensions and social transfers
Source : Eurostat ; Calculations: CSL
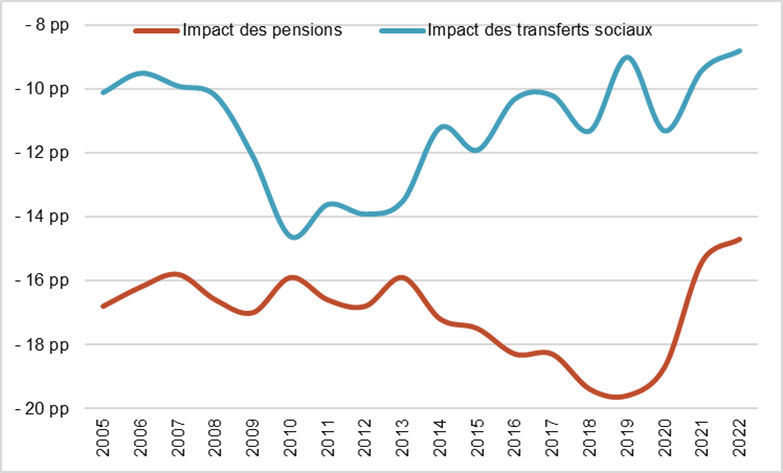
Trends in the impact of social transfers on the at-risk-of-poverty rate
Source : Eurostat ; Calculations : CSL
If we trace the effects of social transfers and pensions on the at-risk-of-poverty rate over time, we can see the growing impact of social transfers between 2005 and 2010. With the deterioration in the country’s social situation and the economic slowdown, the extent of the impact of social transfers has increased by 50%, thus cushioning the rise in the at-risk-of-poverty rate in percentage points before any transfers.
However, since 2010 this impact has been diminishing, with a parallel upward trend in the at-risk-of-poverty rate; 2022 even represents the lowest point of risk mitigation.
Hidden poverty
In addition to the information presented in the previous sections, hidden poverty exists in Luxembourg, as in other countries. Hidden poverty is poorly or not represented at all in the official statistics and affects, in particular, the homeless but also certain sections of the population who may be experiencing financial difficulties.
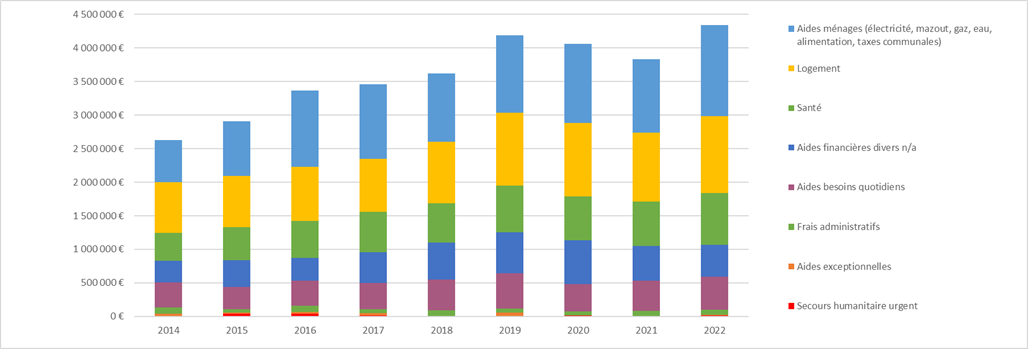
Luxembourg’s 30 social welfare offices play a key role in the fight against poverty and social exclusion. The amount of non-reimbursable aid paid by the social welfare offices to the population rose steadily from 2014 to 2019, then fell slightly in the two years marked by COVID 19. The year 2022 witnessed a rebound in the amount of aid granted by social welfare offices (+13% compared with 2021). This financial assistance covers a wide range of needs: electricity, water, food, health, daily needs, etc. and reflects the precarious situation experienced by some households. With the exception of miscellaneous financial assistance and assistance with daily needs, all items have increased between 2021 and 2022. This increase is particularly marked for assistance with electricity, gas and water (+30%), food aid (+22%) and health (+17%).
Trends in non-reimbursable financial aid provided by social welfare offices
Source: Ministry for the Family and Integration
The largest amounts of aid are household aid, including in particular food aid (76% of household aid) and housing. Food and housing are fundamental and basic needs, so it would seem logical that these should be the areas of greatest need.
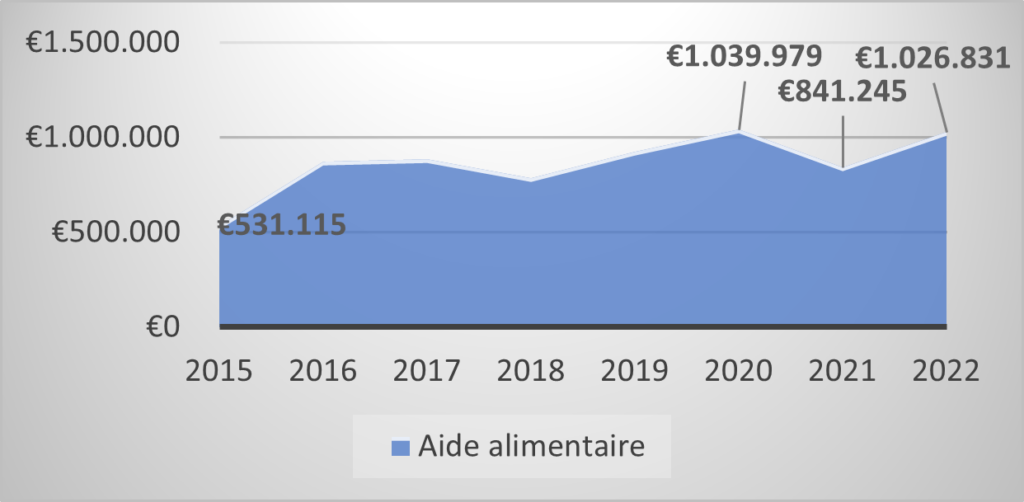
Trends in food aid granted by social welfare offices
Source : Ministry for the Family and Integration
Social welfare offices are not the only organisations helping people in difficulty. There is a whole range of structures that cater for specific categories of people, offering them specific services.
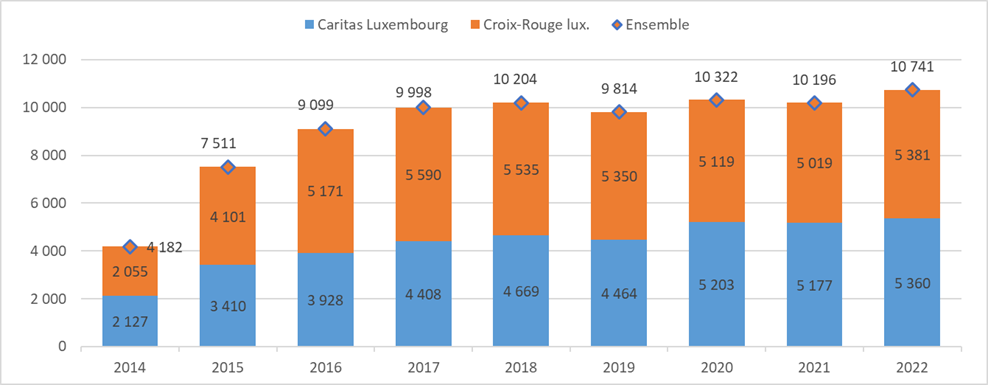
Subsidised grocery shops offer food and hygiene products to people living in poverty at prices up to 70% cheaper than those on the supermarket shelves. These shops have developed in Luxembourg since 2009 and were intended to be a time-limited form of assistance. However, ten years on, they are still present and even multiplying, reflecting the growing needs of the Luxembourg population. Managed by Caritas or the Red Cross, the number of beneficiaries has risen from 4,182 to almost 11,000 in the few years since the scheme was founded. This means that more and more people do not have enough income to meet their basic needs, particularly food and hygiene needs. There was a slight drop in use in 2019, with 9,814 people using the social grocery shops, but since then, use of the shops has significantly passed the 10,000-customer mark. This is hardly surprising, given that the health crisis has been followed by an energy crisis, putting the most vulnerable citizens in difficult situations.